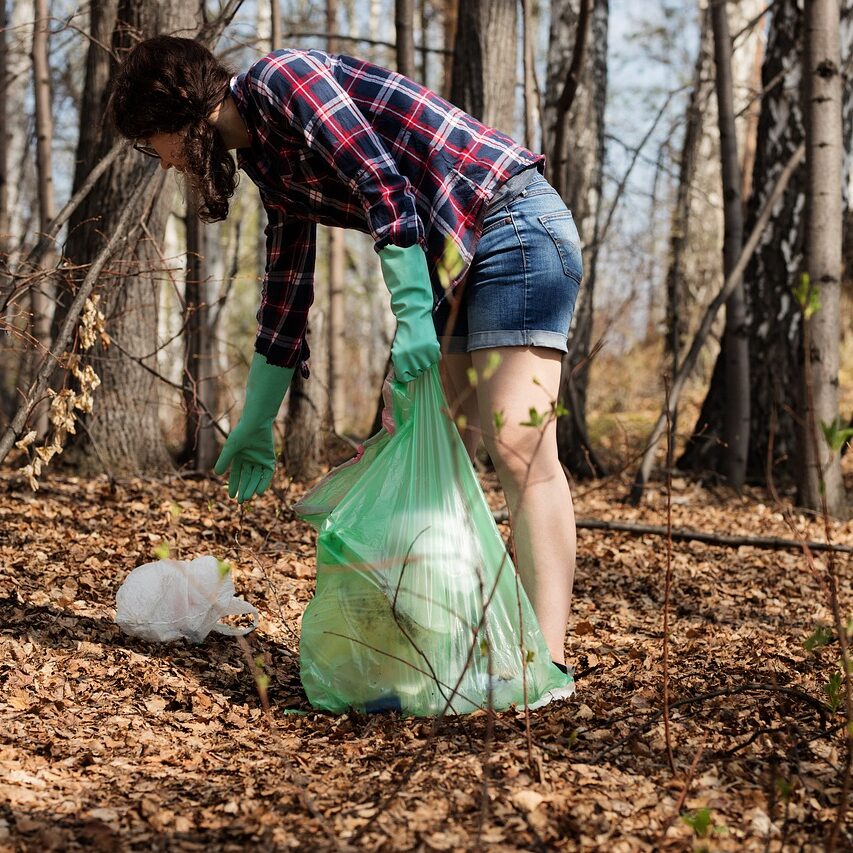
Where have you noticed a problem with waste?
What data could you gather and analyze to learn about the problem?
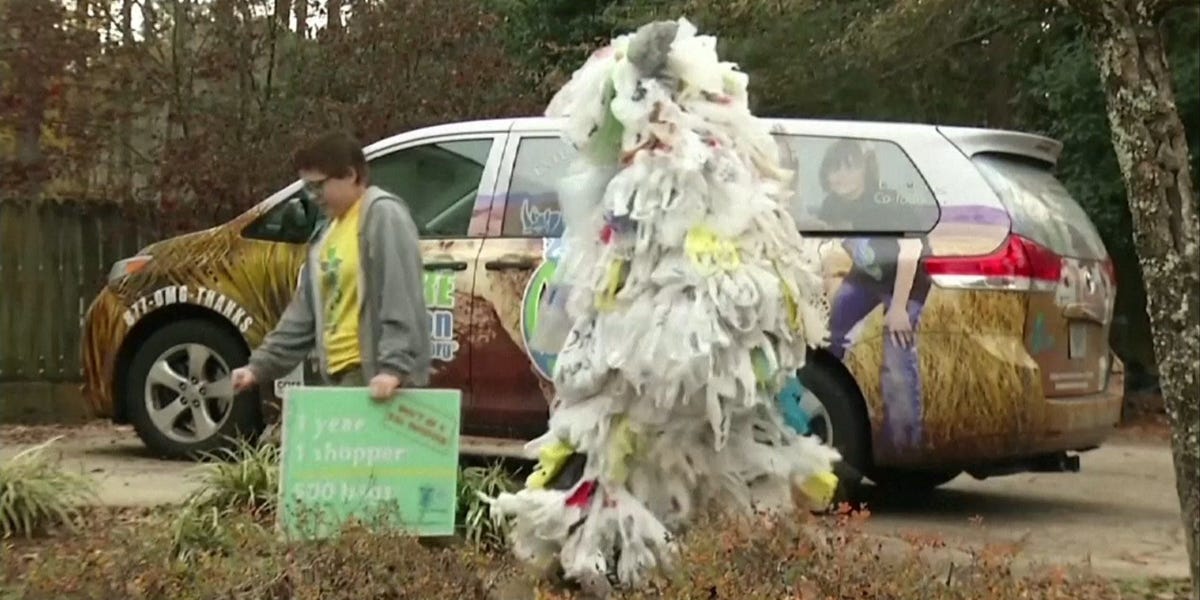
Identify a local problem related to waste
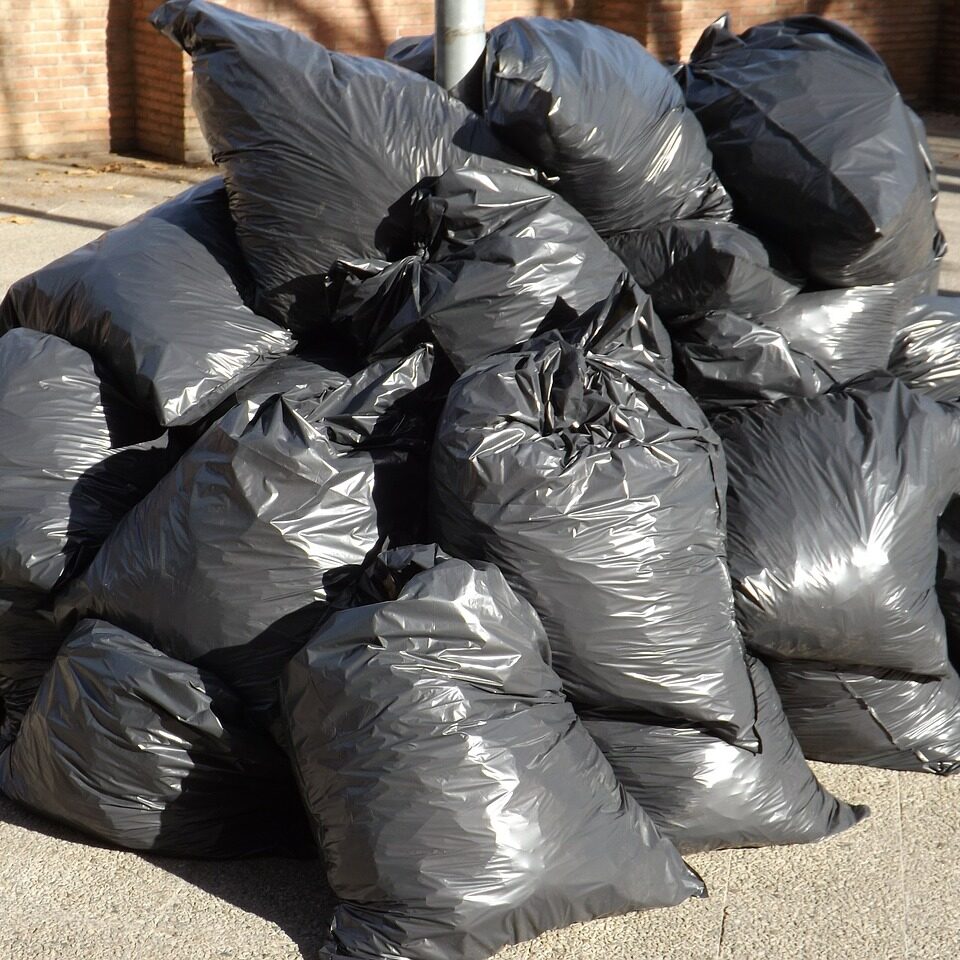
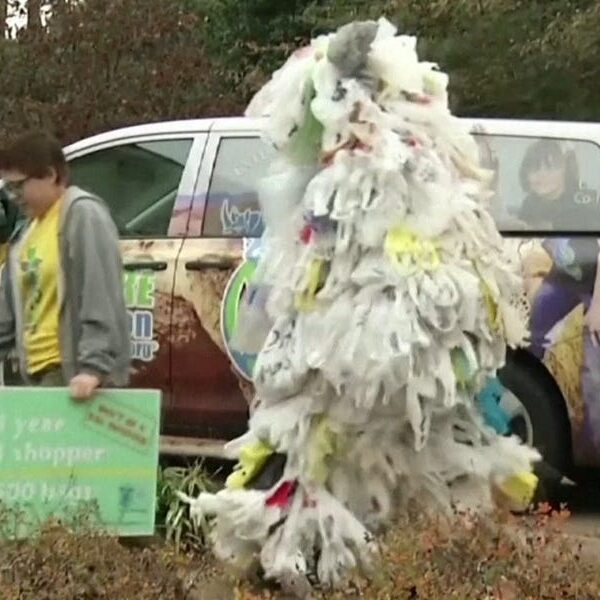
You observed a faraway phenomenon in the film about Midway Island. Now it's time to think about a similar phenomenon you could investigate at a nearby location. Waste can take many forms, from leftover food and trash on the ground to junk cars, outdated electronics, disposable containers, forgotten toys, old clothes, piles of tires, and even sewage sludge. What have you noticed at home, at school, or in the neighborhood?
Decide on a type of data to collect
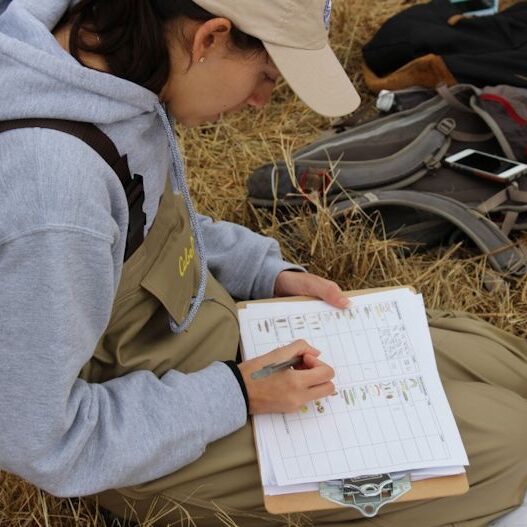
Check out the boxes below to learn about the protocols scientists use to gather data on waste. Think about which method would provide the most useful and relevant information, based on the local problem you have identified to investigate. CHOOSE ONE WAY to collect data at your location.
Take into account whether you have the supplies and resources needed for that type of data collection. (Look at the Supply Lists to see which methods are feasible to do). Consider selecting a community science project that allows you to contribute data to an authentic research project. Or design your own data collection project. If you are working with a team, be sure to confer with your partners and get teacher approval before starting data collection.
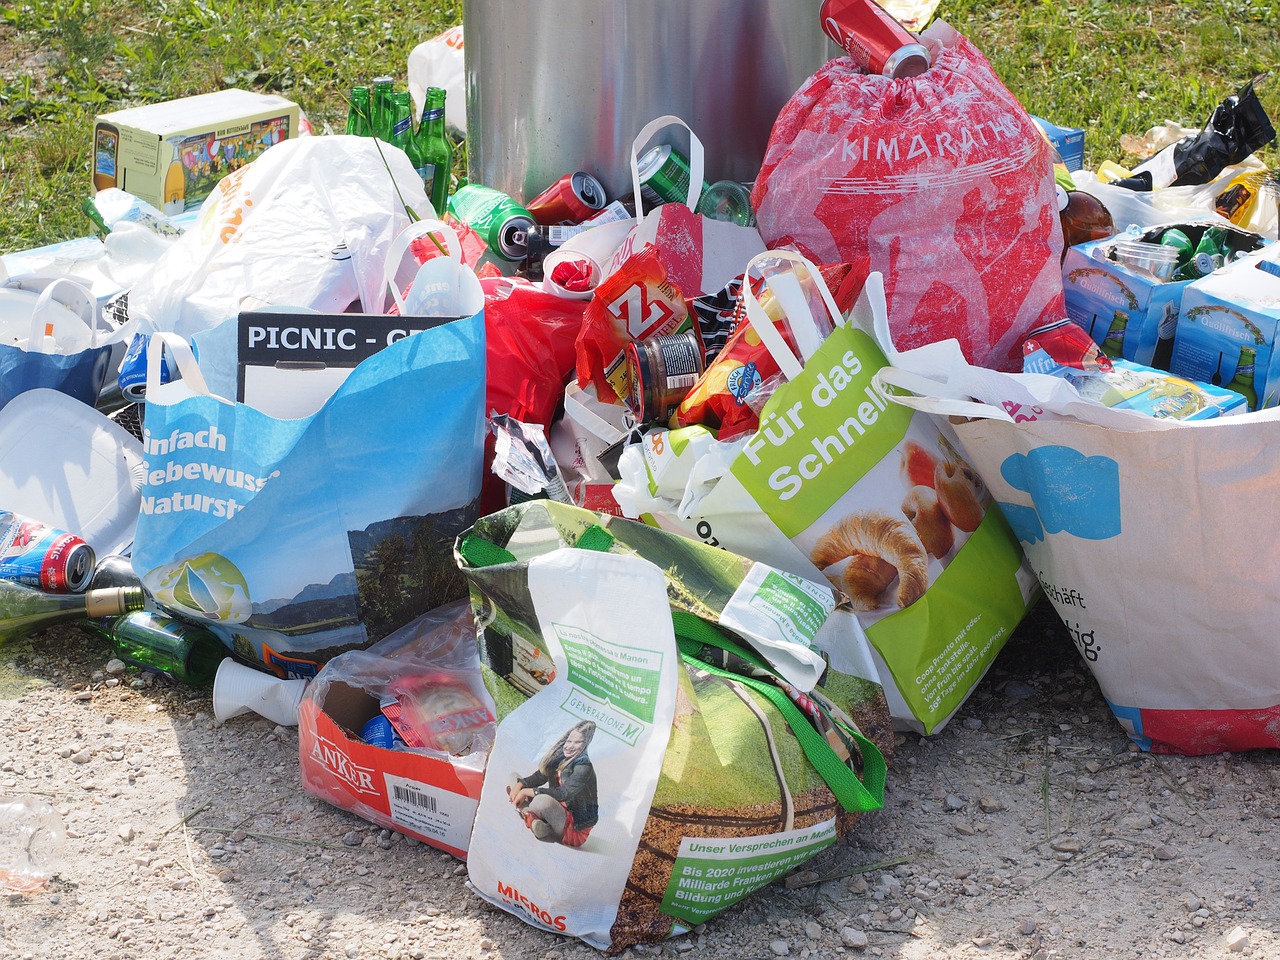
cafeteria Waste Audit
How much waste is generated in the school cafeteria? What types of waste make the biggest share of what goes to the landfill. Is anything being recycled? Composted? Reused or shared? Check out this YouTube video for inspiration:
Garbology Challenge
Collect, weigh, and identify all the waste that you (or your family) produces in a week. Keep track of the leading types and sources of waste. Determine how much of the waste collected could be reused, recycled, or composted. What waste could have been prevented?
Food-printing
The Food-print app allows tracking of leftover single servings of food at participating restaurants, so people can purchase it at a discount, pick it up at a discount price, and save it from the landfill! To find out more about the app and whether it works in your area, click here
Marine Debris Tracker
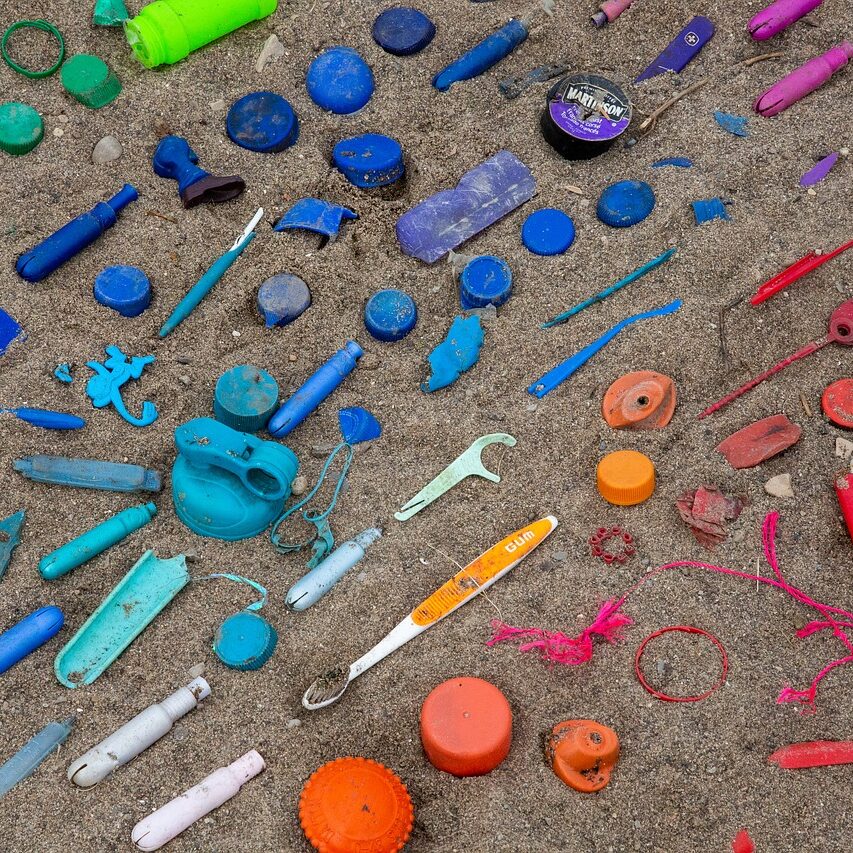
Find out which locations collect the most marine waste on their beaches and coast. Where does the waste come from? How did it get here? Contribute your data to the citizen science project, and supplement your work with other people's data.
Microplastics in SOIL
Mark a 1 meter square area, sift soil, lift potential microplastics to filter paper with tweezers, and count (or weigh) the plastics. Use this Microplastics Identification Guide to clarify which objects are plastics. Do not return waste to soil.
LITTERATI
What are the most common types of litter in your schoolyard or community? Who makes or sells the products that are being littered? Who does the littering? Collect and categorize litter; contribute your data to real research.
Analyze your data

- Display the data in labeled charts or graphs using Excel, Create-A-Graph, or handmade charts
- Look for trends or patterns
- Interpret your data by explaining the significance of your findings
Organize and show your data in graphs, charts, or infographics to make it easy to analyze and explain the significance of your findings. What does your data mean and why does it matter?

