What living things share the schoolyard with us?
How can we collect data about the species that live here?
How biodiverse an ecosystem is this?
Decide on the type of data to collect and do it
Check out the boxes below to find out ways that scientists gather data on an area's bioidversity. Think about which method will provide you with the most useful information, based on your observation and prediction about its condition. CHOOSE ONE WAY to collect data on your chosen area. Then take into account whether you have the supplies and resources needed for that type of data collection. Don;t worry if there isn't a lot of nature around you: some of the resources are specifically designed for cities and urban areas. Look at the Supply Lists and protocols to see which tests are feasible to do. If you are doing this as part of a class project, be sure to get your teacher's approval before starting.
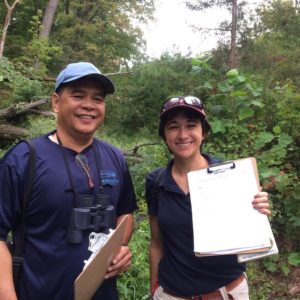
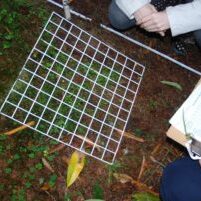
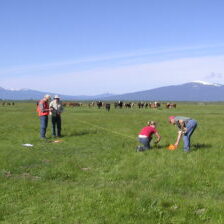
Quadrat and Transect Sampling
Use quadrats to randomly select an area of your garden or school yard, and then investigate the biodiversity of the life within that area. Or use transects and quadrats to see how the biodiversity changes as you move across your garden or schoolyard. Quadrats provide a precise, randomized, and repeatable way of collecting biodiversity data in your chosen area!
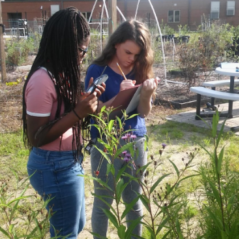
Vegetative Survey
This data collection protocol allows you to collect data on the number of each species of plant in an area, allowing you to determine the biodiversity of the plants in the area. There is also an emphasis on determining which plants are native and which are invasive, to see what effect invasive species have on biodiversity.
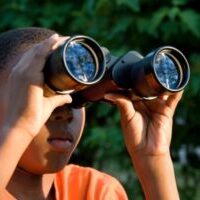
Wildlife Survey
This data collection protocol allows you to determine the biodiversity of an area based on the animals you see. Make sure you remain extra quiet, so you don't scare the animals away!
Bioblitz by i-Naturalist
This app by i-Naturalist challenges you to count as many species as possible within a certain time limit. It automatically tallies the number of species you find, using your data to contribute to citizen science projects, while also allowing you to learn about the biodiversity of your location!
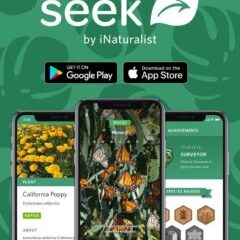
Seek by i-Naturalist
This app uses automatic image recognition technology to identify the plants and animals around you. This way, you don't need to be an expert to identify the critters and plants in your area, allowing you to count the number of different species, and determine the biodiversity of the area. Seek also suggests species commonly found in your area, and allows you to earn badges as you find more species.
What's good in my hood workbook
This survey is targeted at those finding themselves in cities with little nature. While it challenges you to find animals and plants in your area, you also have the chance to record non-living, man-made objects, allowing you to determine the effect of humans on biodiversity. Refer to pages 5 - 7 for the data collection survey.
Organize and show your data in graphs, charts, or infographics that make it easy to analyze and explain the significance of your findings. What does your data mean and why does it matter?

