Is your creek polluted or clean?
What data do you need to collect to find out?

Observe a stream, pond or ditch in the schoolyard or nearby
You observed a phenomenon on video, in the last section. Now it's time to apply your thinking about that phenomenon to a nearby waterway. Go visit a stream, pond or ditch. What do you notice about it? Does the water look clear? Can you see to the bottom? How does it smell? Are plants and trees growing on both sides of the stream, providing wildlife habitat? Is the stream free of trash? Is the soil on the streambanks staying in place; not washing away? Based on what you've noticed, would you guess that the water quality is good (healthy for wildlife) or bad (polluted)? Make a prediction in your Portfolio.
Decide on the type of data you will collect
Check out the boxes below to discover ways that scientists gather data on streams. Consider which method will provide you with the most useful information, based on your observation and prediction about water quality. CHOOSE ONE WAY for your team to collect data on your stream. Then take into account whether you have the supplies and resources needed for that type of data collection. No water on campus or nearby? Don't worry - some types of data can be collected from a dry creekbed, a ditch, or an ephemeral (part-time) stream. Look at the Supply Lists and protocols to see which tests are feasible to do. If you are doing this as part of a class project, be sure to get your teacher's approval before starting. [Note: Some supplies for Physical and Chemical Testing as well as Macroinvertebrate Sampling are provided in Captain Planet Foundation's ecoSTEM Water Kit. Ask your teacher what materials are availale for your use.]


![]() Contribute your data to a Citizen Science Project, if needed
Contribute your data to a Citizen Science Project, if needed
You have your own reasons for collecting a certain kind of data: you're trying to get answers to your questions and to determine if your suspicions are correct about whether a body of water is clean and healthy or polluted.
But there may also be scientists who are crowdsourcing (inviting people to contribute data) for a Citizen Science Project. If the type of information you're collecting happens to be needed for an ongoing research or monitoring project, please consider sharing your data. Look for the magnifying lens icon below to see which collection methods will yield information currently needed for a Citizen Science Project.
Streamside Habitat Survey
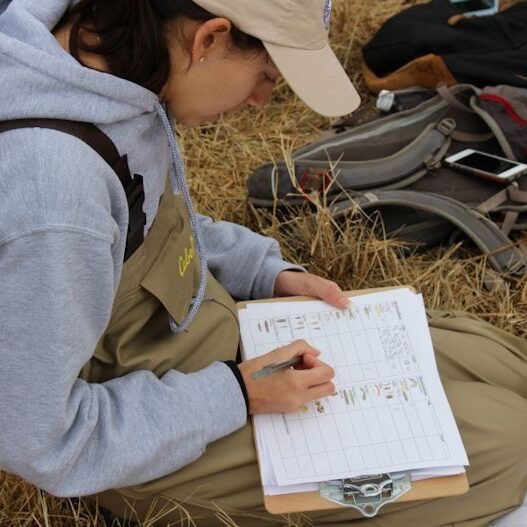
Whether you are investigating a dry ditch or a swollen river, a Streamside Habitat Survey will yield useful data. Walk along the stream for at least 100 meters and use your powers of observation to collect and report data on this Streamside Habitat Survey form. Note that you will be assigning a score for each category, compared to the criteria and illustrations provided. These scores for each feature, as well as the overall total, are your data. The ideal score for each category is a rating of 10, as defined by the Georgia Adopt-A-Stream program.
PHYSICAL & CHEMICAL TESTING
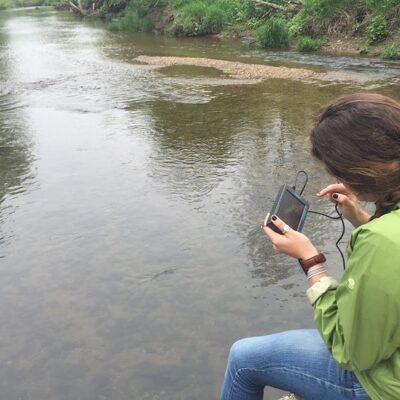
If you suspect the water quality of your stream is affected by erosion (stream banks with exposed soil and no plants), or a high level of nutrients (chemicals from fertilizer, animal waste, or detergents), toxins (including pesticides or herbicides), or oil (from upstream roads and parking lots) then physical and chemical testing can provide relevant data. This GREEN Water Quality Monitoring Manual from Earth Force provides info on water testing protocols. [Note: Supplies for Physical and Chemical Testing are provided in the ecoSTEM Water Kit.]
macroinvertebrate sampling
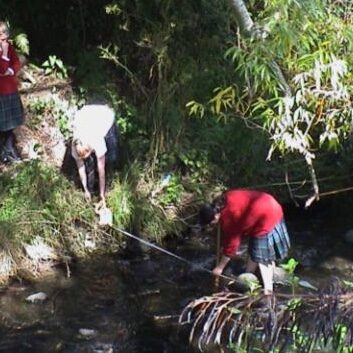
The presence or absence of aquatic macroinvertebrates, including certain insects or their larvae, can reveal a lot about the health of a stream. Some critters are known to be sensitive to pollution, so their presence indicates good water quality. Other critters are tolerant of pollution and can live anywhere. Collecting data on which macroinvertebrates are present and assigning each species a pollution-sensitivity score on this form, can indicate stream health. [Note: Most supplies for Macroinvertebrate Sampling are provided in the ecoSTEM Water Kit.]
Organize and show your data in graphs, charts, or infographics that make it easy to analyze and explain the significance of your findings.
What does your data mean and why does it matter?
Organize and show your data in graphs, charts, or infographics that make it easy to analyze and explain the significance of your findings. What does your data mean and why does it matter?


