Earth
GATHER
Is the soil in your location suitable for the area?
What data do you need to collect to find out?

Find a nearby location which makes use of its soil
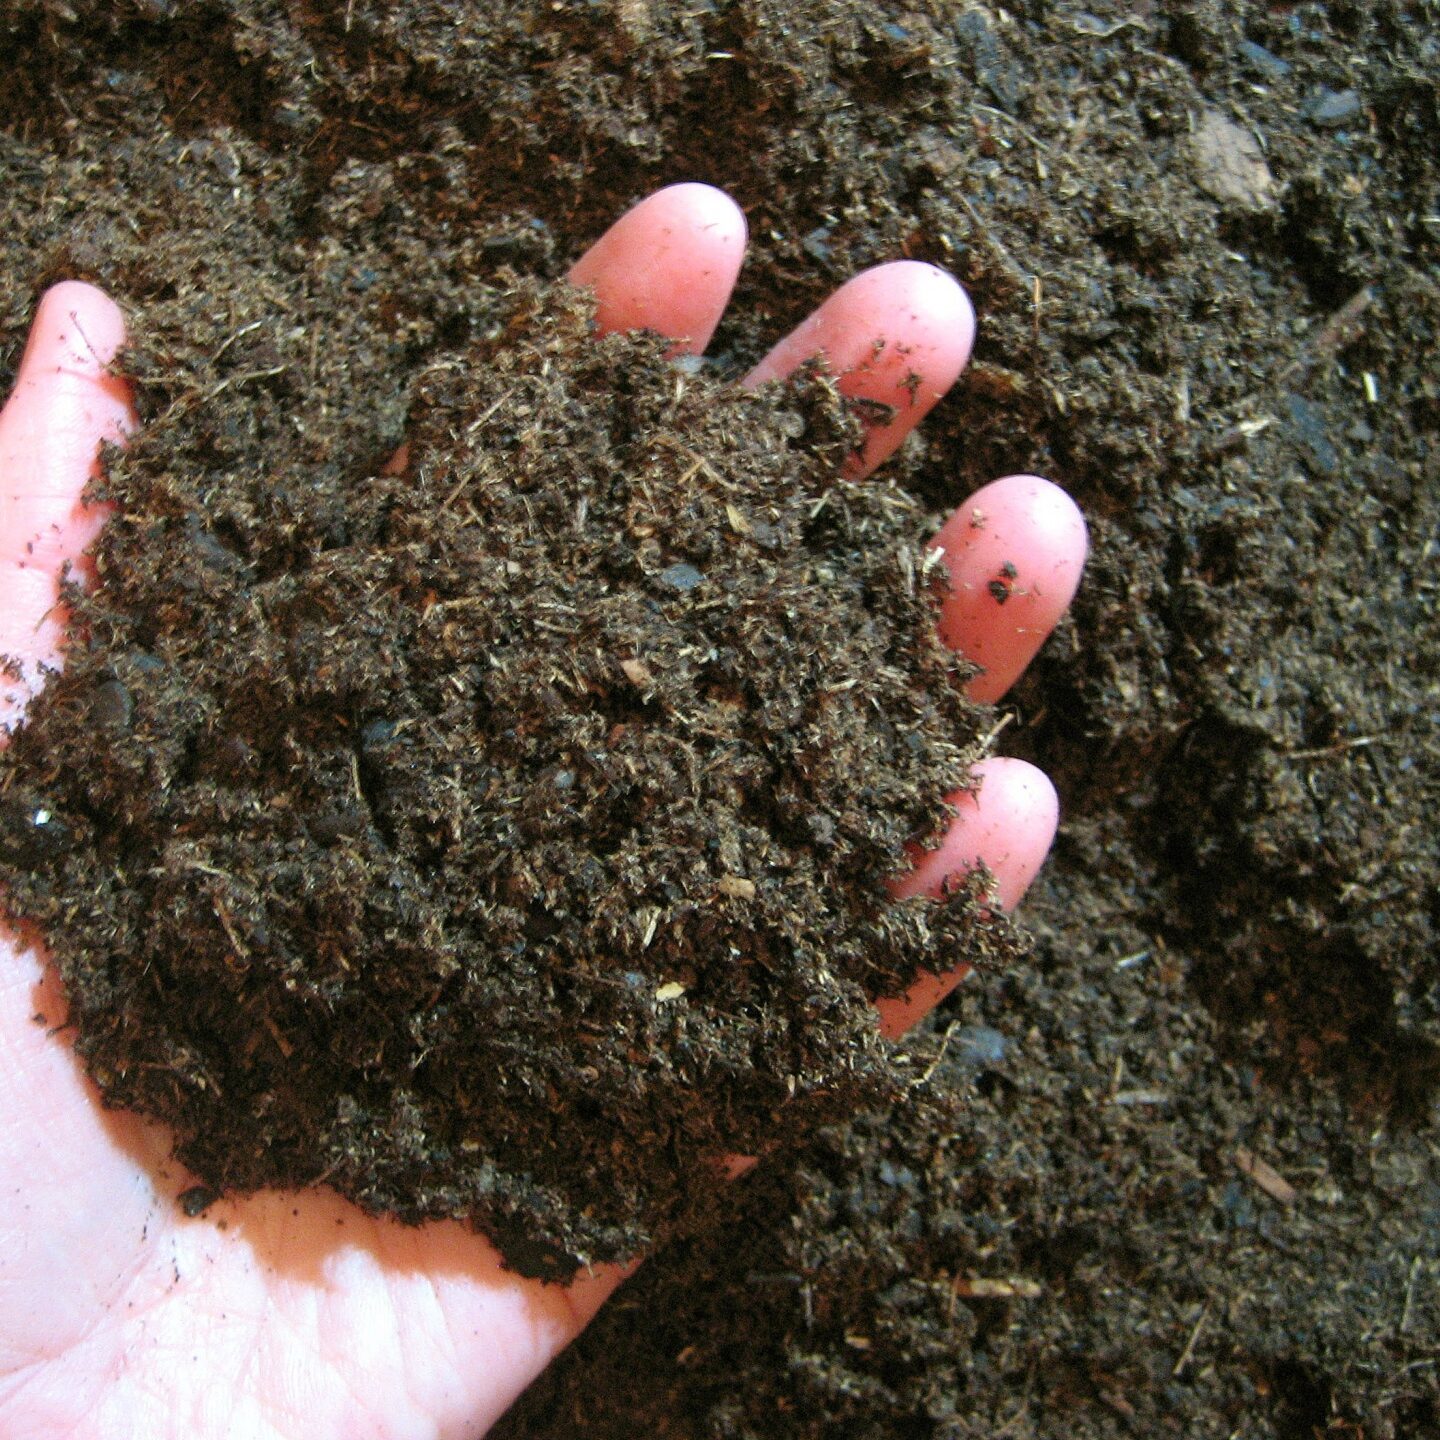
You observed a phenomenon on video, in the last section. Now it's time to apply your thinking about that phenomenon to a nearby area. Go visit an area that uses its soil. For an example, find a field that grows a crop, or a flower bead, or even a compost heap. What do you notice about it? Does the soil look healthy and moist, or dry and crumbling, or even too wet and soggy? What color is the soil? How does it smell? Are there plants growing in the soil, and do they look healthy? Based on what you've noticed, would you guess that the soil quality is good (healthy for the location and the plants growing in it) or bad (unhealthy, and killing the plants growing in it)? Make a prediction in your Portfolio.
Decide on the type of data you will collect and do it
Check out the boxes below to find out ways that scientists gather data on the earth. Think about which method will provide you with the most useful information, based on your observation and prediction about its condition. CHOOSE ONE WAY to collect data on your location. Then take into account whether you have the supplies and resources needed for that type of data collection. Look at the Supply Lists and protocols to see which tests are feasible to do. If you are doing this as part of a class project, be sure to get your teacher's approval before starting.

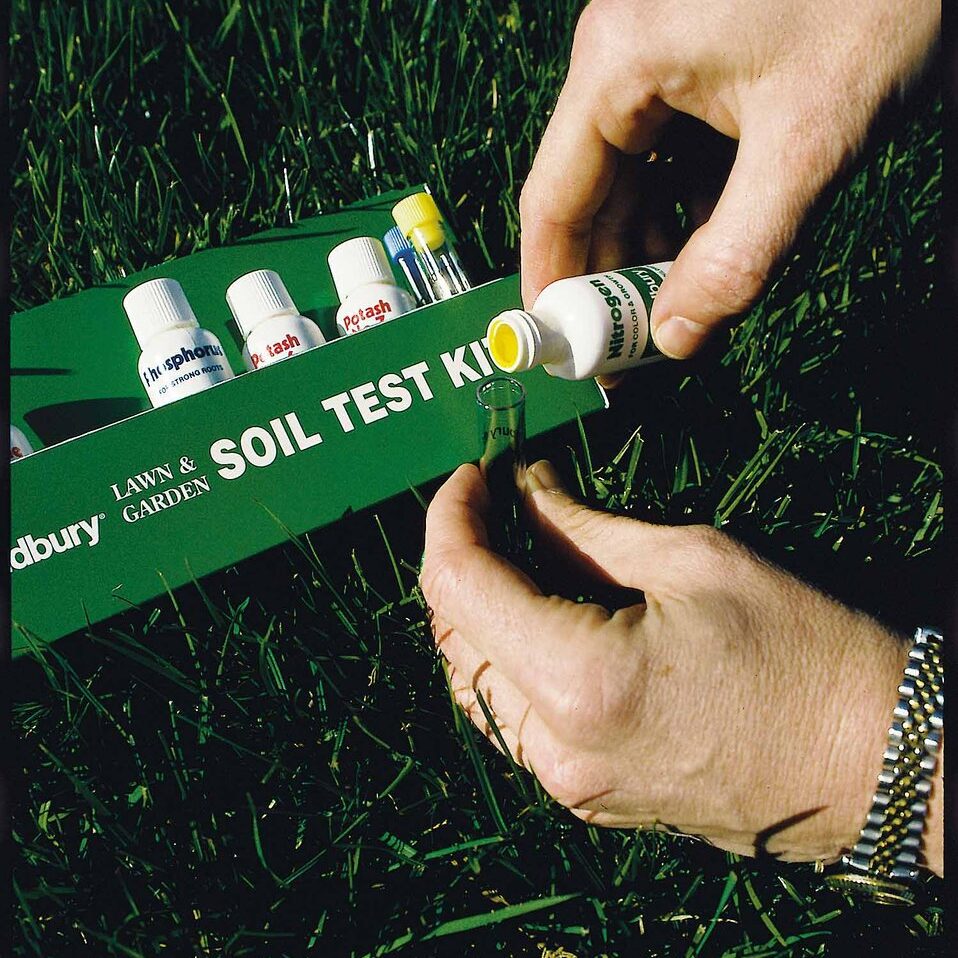
Test Soil Fertitlity (Nutrients)
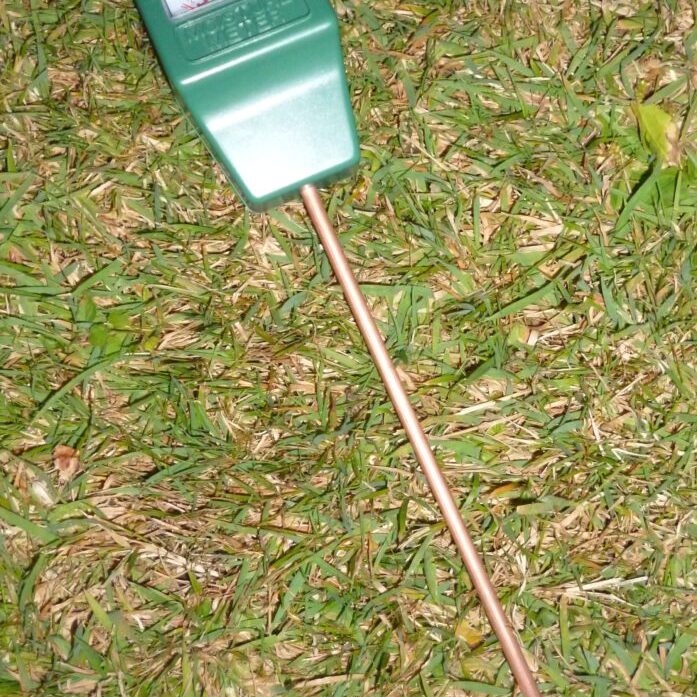
Different plants require different nutrients to grow in a soil. Determine whether the soil at your location has the correct nutrients for plants to grow using a soil test kit. You will test for nitrates and phosphates as well as other nutrients.
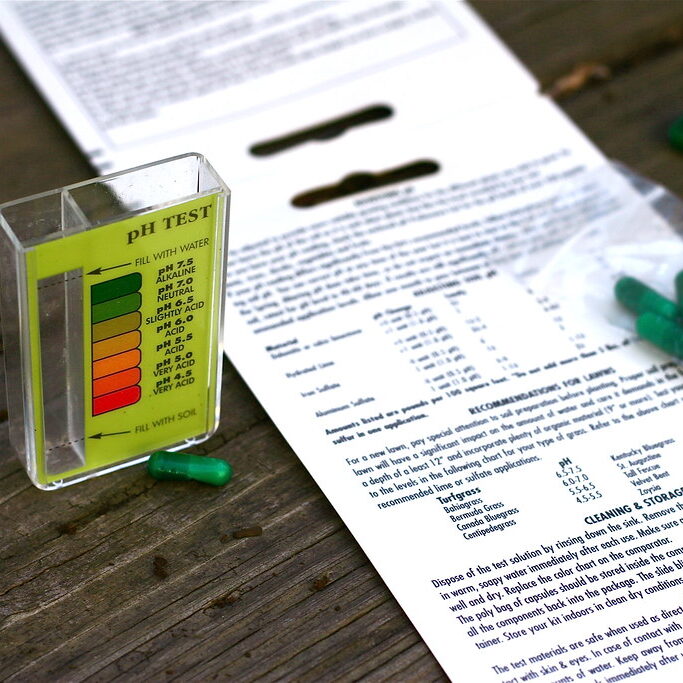
Test Soil pH
Having the correct pH is vital for soil to host life. If soil is too acidic, it will kill all the life living in it. On the other hand, if it is too alkaline, exactly the same thing will happen. As a result, most soils are close to neutral on the pH scale. Some plants prefer slightly acidic or alkaline conditions, so there is some variance in the pH of soils. Conduct a pH test to determine the pH of your soil, and think about what is causing that pH. Is the pH suitable for plants?
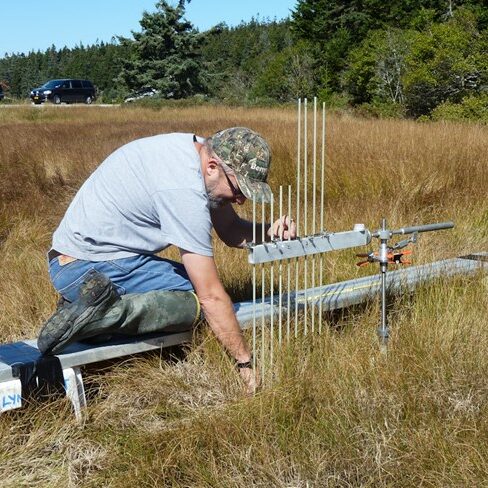
Test Soil Carbon Change
With the atmosphere's carbon dioxide levels constantly rising, there have been suggestions that returning carbon into the soil could be a potential solution. Plants take carbon dioxide out of the atmosphere, and sequester it back in the ground. Find out if the soil around you is gaining or losing carbon around you, to see how the soil can impact the environment, as well as determining the health and effectiveness of the plants in the area.
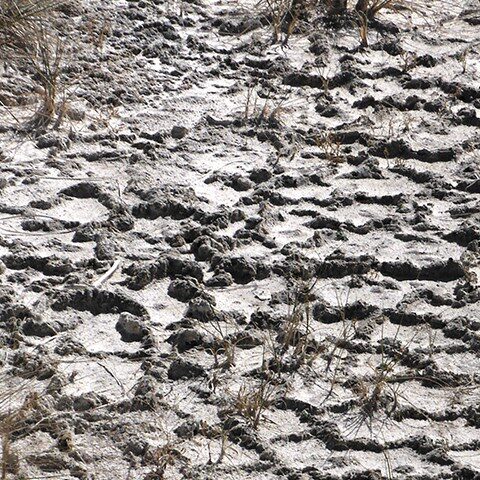
Test Soil Particle Size
Conduct tests on the make up of the soil to determine what type of soil it is, and as a result what sort of environment it provides and which plants and animals it can support.
Organize and show your data in graphs, charts, or infographics that make it easy to analyze and explain the significance of your findings. What does your data mean and why does it matter?

