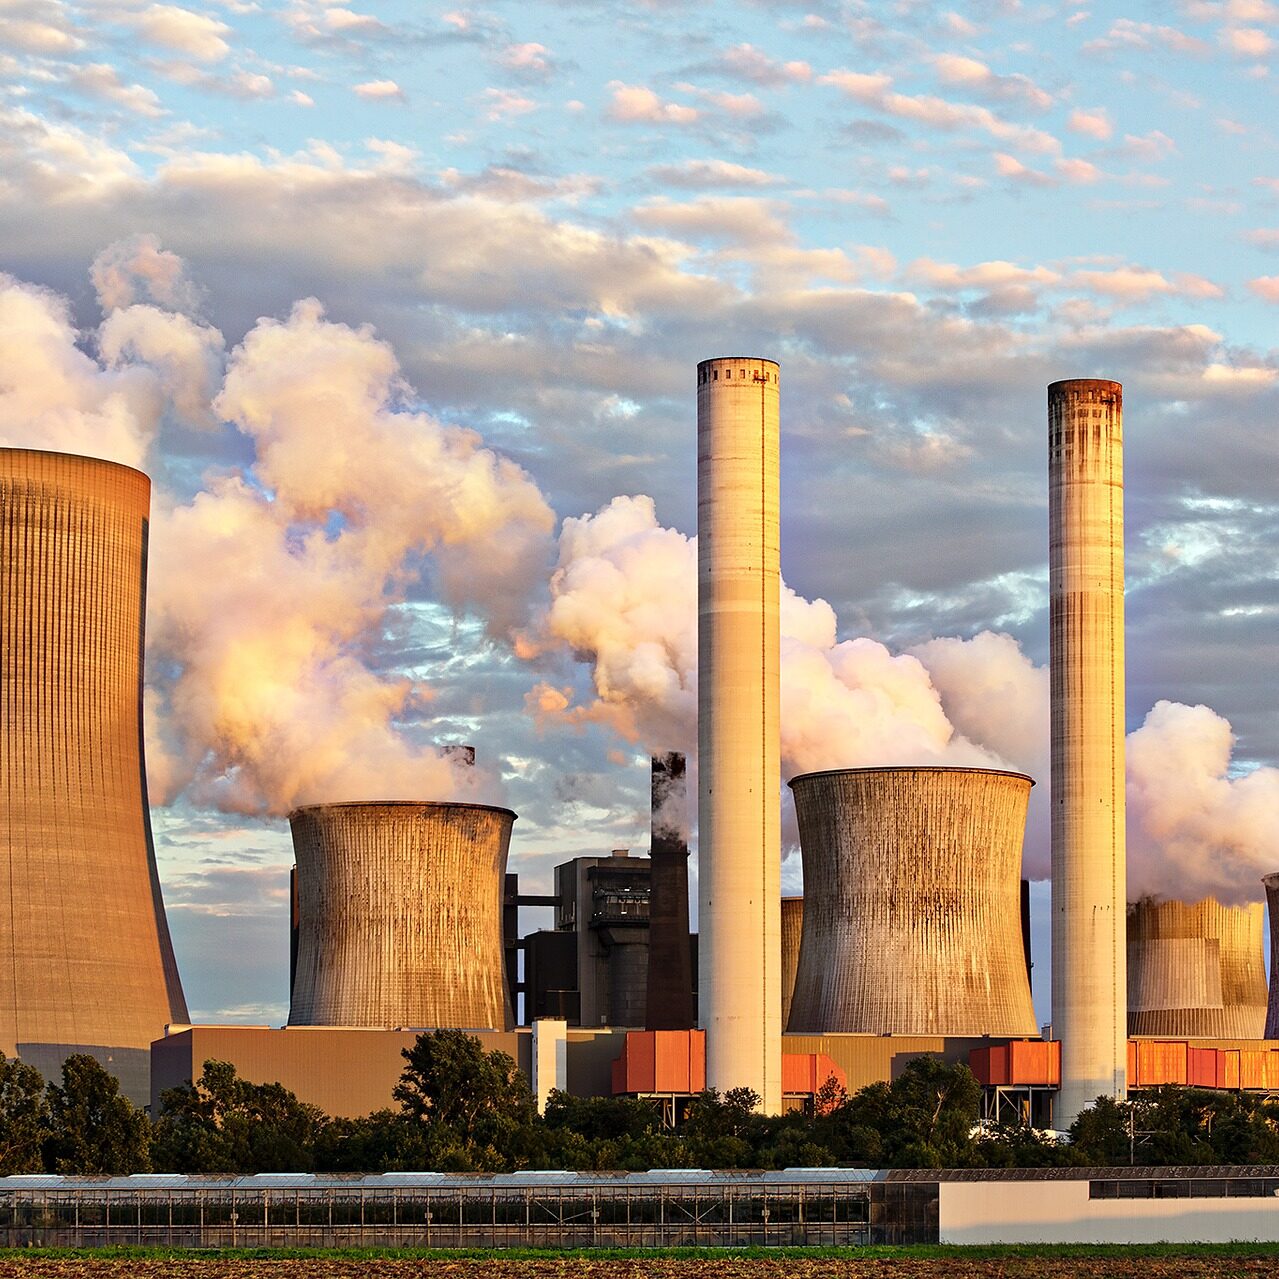
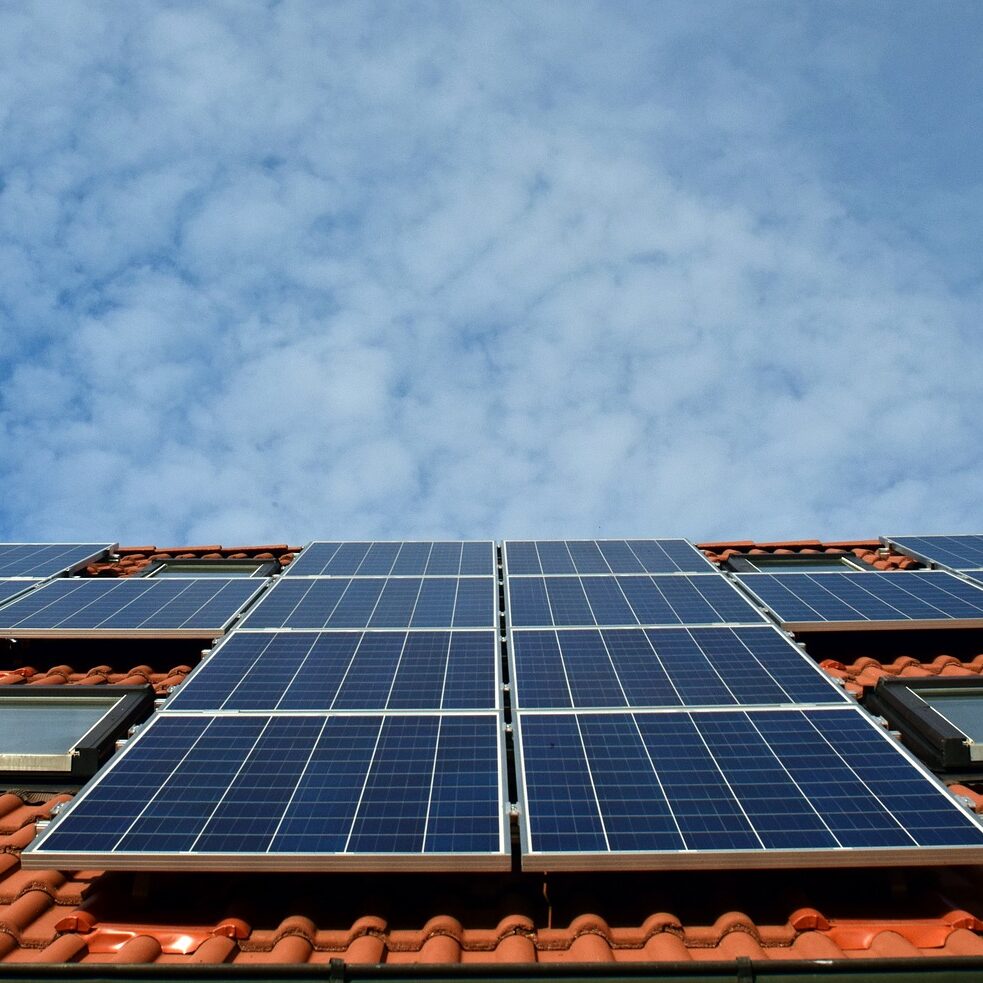
How does your school consume energy?
Is it supplied by any renewable sources?

Investigate a room or building near you
You observed a phenomenon on video, in the last section. Now it's time to apply your thinking about that phenomenon to a nearby area. Find a building or area near you, and determine what its energy sources are. Where is the energy coming from? Is it using renewable or non-renewable resources? Make a prediction in your Portfolio.
Decide on the type of data you will collect and do it
Check out the boxes below to find out ways that scientists gather data on energy consumption and production. Think about which method will provide you with the most useful information, based on your observation and prediction about its condition. CHOOSE ONE WAY to collect data on your chosen location. Then take into account whether you have the supplies and resources needed for that type of data collection. If you are doing this as part of a class project, be sure to get your teacher's approval before starting.

Review Energy Bills
If possible, request access to your schools energy bills. This will allow you to determine how much energy your school uses, how much it costs, and also how your school's energy use changes over time. You will also find out about your school's energy supplier, and what they do to supply your school with energy!
Energy Vampire Audit
Visit classrooms in your school, and find out how much energy is being wasted while the classroom is not in use. Keep score of the number of items found on and running while not being used. This can include light bulbs, TV screens or air conditioning systems. You can also time how long items are being left turned on for, before someone notices and turns them off.
Profile School's Energy Sources
Find out where your school's energy comes from, by identifying all of its providers. Then, find out how the provider produces the energy, to determine exactly what energy sources your school uses. What proportion of your school's energy comes from fossil fuels? Are there any renewable energy sources?
Profile Your Energy Sources
Find out where your home's energy comes from, by identifying all of its providers. Which energy company do you use? Does your house have any solar panels? Are there any alternative options? Try to determine the proportion of your house's energy supply comes from fossil fuels, and what proportion comes from renewable sources.
Interview A School Official
Interview the principal or maintenance staff, to find out how the school is supplying and using its energy, and what the reasons are behind those energy choices. In particular, what does your school do to use renewable energy sources, and are there any future plans to incorporate more renewable energy sources?
Research Existing Data
A lot of data has been collected already, waiting to be graphed and analysed. See if you can find data on your town's, county's, state's, or even country's energy consumption, and how that energy consumption has changed over the past few years. What trends can you see in energy consumption?
Organize and show your data in graphs, charts, or infographics that make it easy to analyze and explain the significance of your findings. What does your data mean and why does it matter?


